![A logo for a tech-focused website that aims to simplify and streamline technology for its audience, with a clean and modern design that embodies simplicity and functionality [using a sleek and minimalistic approach] [incorporating tech-inspired elements]](https://jacksonisaac.com/wp-content/uploads/2024/03/img-i0qijphmwgcu5l9lakcrkyq6.png)
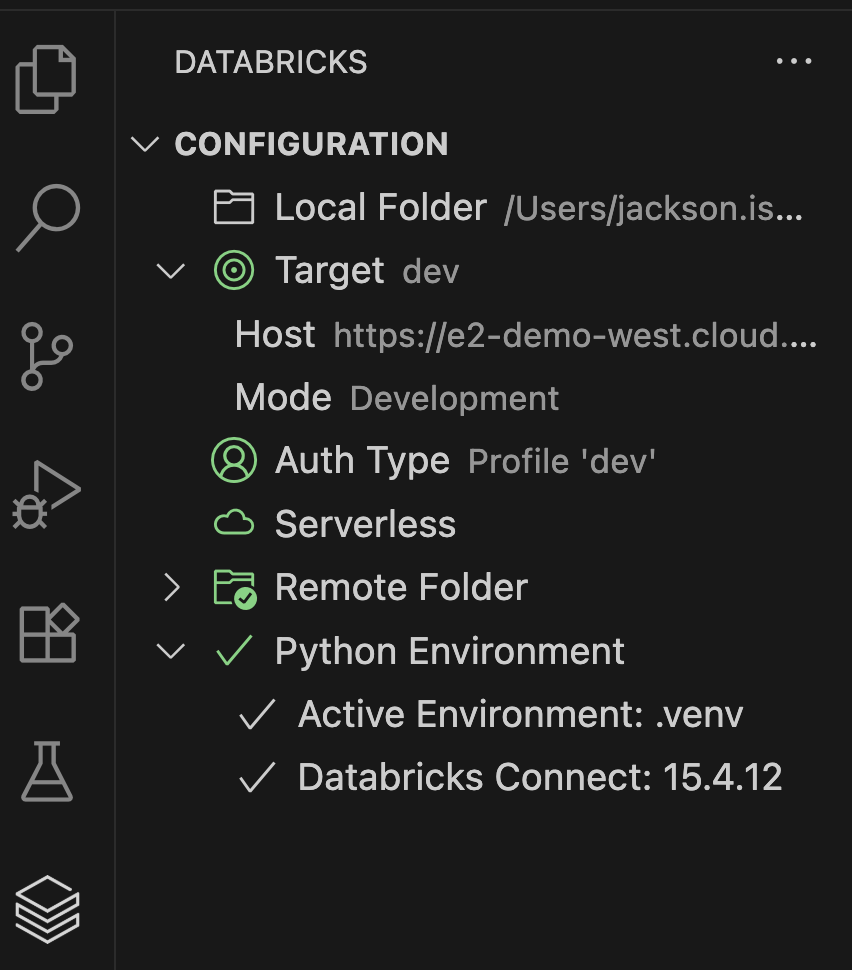
In this blog post, I will share my experience connecting VS Code and a Databricks environment, which enabled advanced debugging and local multi-file breakpoints. What? The aim of the blog is to enable fast and iterative test-driven development (TDD) using VS Code (local editor) and Databricks environment (scalable remote execution) Why? In my interactions with … Continue reading [How-to] Configure VS Code with Databricks Connect for local debugging
FUDCon ’15: A Speaker’s Diary
Hola Amigos, It's been quite some time now that I have updated my blog due to my busy schedule, GSoC 2015 and campus placements!. So today I am going to share my experience at FUDCon 2015, Pune. I had proposed a session on "Python Code profiling using line_profiler" at fudcon.in. One fine day around the … Continue reading FUDCon ’15: A Speaker’s Diary
[OSFY]: Improve Python Code by Using a profiler
Hola amigos, I am glad to inform you all that I have successfully published my Second article for 'Open Source For You (OSFY)' magazine, September 2014 Edition, titled 'Improve Python Code by Using a Profiler'. To download and view the article please click on the above link. In this article I have shared about using … Continue reading [OSFY]: Improve Python Code by Using a profiler
using line_profiler with python
This post will help you to use line_profiler for python (2.5.x) as well as python3 (python 3.x) line_profiler will help you to profile the time taken to execute each individual lines of code. The profiler is implemented in C via Cython, an optimizing static compiler for Python programming language as well as Cython programming language … Continue reading using line_profiler with python
