![A logo for a tech-focused website that aims to simplify and streamline technology for its audience, with a clean and modern design that embodies simplicity and functionality [using a sleek and minimalistic approach] [incorporating tech-inspired elements]](https://jacksonisaac.com/wp-content/uploads/2024/03/img-i0qijphmwgcu5l9lakcrkyq6.png)
In this blog post, I will share my experience connecting VS Code and a Databricks environment, which enabled advanced debugging and local multi-file breakpoints.
What?
The aim of the blog is to enable fast and iterative test-driven development (TDD) using VS Code (local editor) and Databricks environment (scalable remote execution)
Why?
In my interactions with colleagues and customers, I come across similar questions – ‘I want to use my favourite IDE’ and ‘Debugging on browser-based notebook interface is not advanced for my requirements’
‘Can we make use of our favourite IDE (Spyder, VS Code, PyCharm, etc.) and connect to Databricks compute?’
Since few years, the answer is yes 🙂 Using Databricks connect this is possible, but there were still some uncertainties on how to setup a seamless connection.
This also reduces the need to set up a complex local environment, including Spark and all the libraries that are pre-built on the Databricks runtime.
How?
Prerequisites:
– Install VSCode
– Databricks account and workspace access
– Databricks compute available (cluster, SQL warehouse, or serverless)
– Python installed locally (match compute version)
Step 1: Install the Databricks extension

Step 2: Configure Databricks project

For this you need the following details:
– Databricks Host URL (AWS Example: https://dbc-a1b2345c-d6e7.cloud.databricks.com, Azure Example: https://adb-1234567890123456.7.azuredatabricks.net, GCP Example: https://1234567890123456.7.gcp.databricks.com)
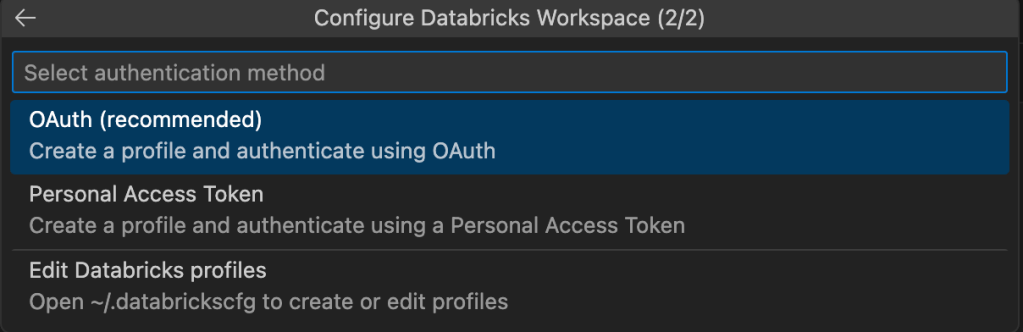
– Authentication Method (OAuth is recommended, you can also edit an existing configuration profile)
Step 3: Select the project type based on your use-case requirement

– Enter the project name

Step 4: Open the created project folder

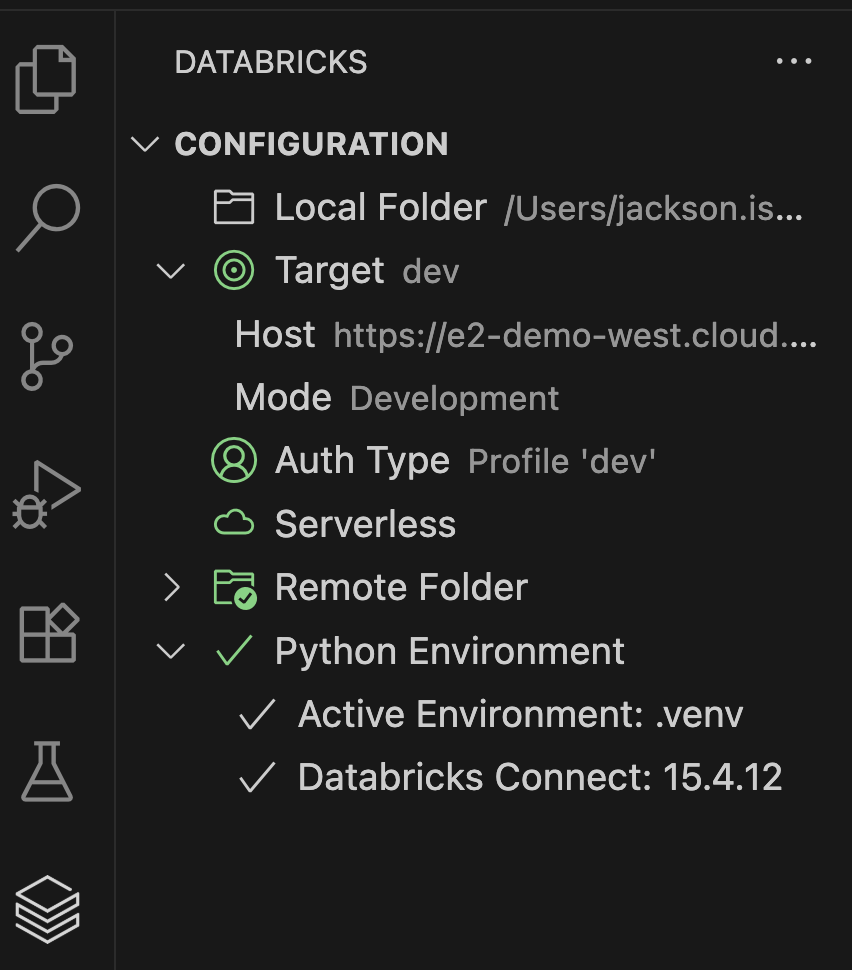
Step 5: Connect to Databricks compute

Once everything is successfully connected, it should look like below:
Note: For smooth functionality, I recommend to select and use the same Python version as the Databricks compute.
In case you have a different version of Python you will see a warning as shown in the example below:

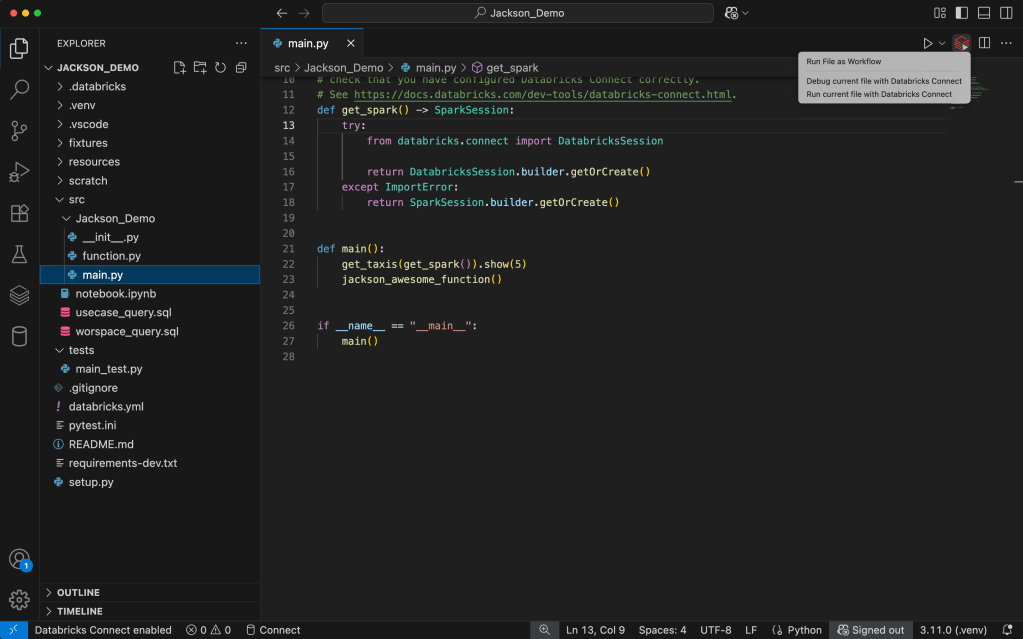
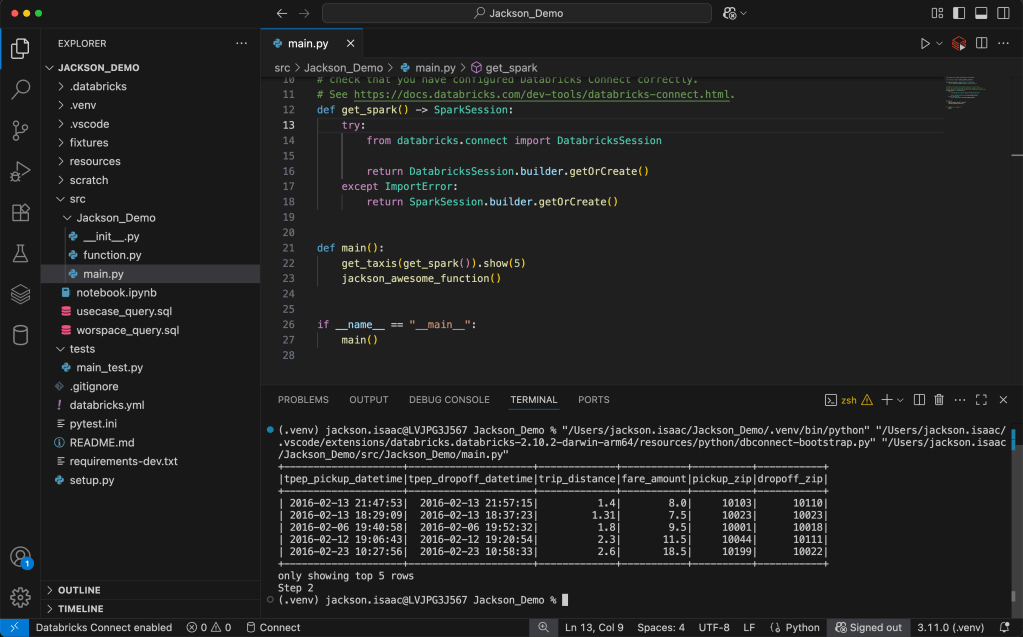
Once all the above steps are executed successfully and all the checks are green, we can run our first code on Databricks compute right from the VS Code.
Step 6: Run code on Databricks compute

Step 7a: Add breakpoints and debug
You can add simple breakpoints or for advanced debugging also multi-file breakpoints.
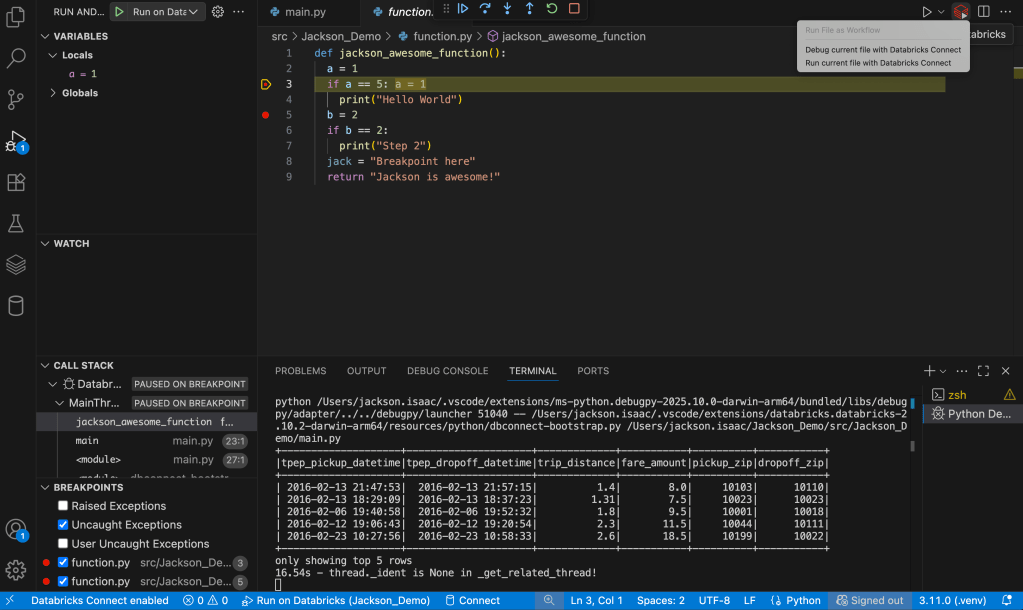
This gives you the best of both worlds, advanced local debugger and the compute of cloud via Databricks Connect
Step 7b: Verify results in Terminal/Output
</end>
The aim of the above blog is to help you follow and perform same steps with visual representations.
If you run into issues, leave a comment and I’ll update this guide.
